Azure Vs. AWS Vs. Google Cloud: Customer Spending Results, Flexera Report
From nearly 25 percent of AWS and Azure customers spending between $500,000 to over $5 million each month to cloud adoptions rates of Google Cloud, here’s five key data results from Flexera’s new cloud report that all partners and customers should know about.

Over 750 executive leaders and IT professionals weighed in on how much their company is spending on AWS, Microsoft Azure and Google Cloud as well as use of cloud providers’ discounts and adoption rates.
With nearly 25 percent of AWS and Azure customers surveyed spending between $500,000 to over $5 million each month, understanding cloud spending trends, discounts and adoption rates is critical for many organizations.
These results are based off Flexera’s new 2024 State of the Cloud Report unveiled on Tuesday, which gives powerful insights into how AWS, Microsoft Azure and Google Cloud Platform (GCP) customers are using and spending on the world three largest cloud platforms.
[Related: 6 AWS Execs Who Left In 2024 For Microsoft, Google, Cisco And Others]
Flexera surveyed over 750 IT professionals and executive leaders on a global basis in late 2023. The majority of respondents were employed by companies with 1,000 to 100,000 employees with 62 percent of respondents headquartered in the U.S.
AWS, Google, Azure Cloud Market Share
Before jumping into the results of Flexera’s new cloud report, let’s quickly look at the most current global cloud market share rankings as of fourth quarter 2023.
Seattle-based AWS is the worldwide market share leader in cloud infrastructure services owning 31 percent share, followed by Redmond, Wash.-based Microsoft at 24 percent global share, then Mountain View, Calif.-based Google Cloud at 11 percent share.
Combined, these three cloud giants own approximately two-thirds of the global cloud computing market, according to research firm Synergy Research Group.
Although Microsoft, Amazon and Google own the lion’s share of the public cloud market, Flexera also includes customer data and results from IBM Cloud, Oracle Cloud Infrastructure and Alibaba Cloud. IBM, Oracle and Alibaba Cloud each own between 2 percent and 4 percent of the global cloud market.
CRN breaks down five of the most important results from Flexera’s new 2024 report that every AWS, Azure, GCP and cloud customer and partner should know about.
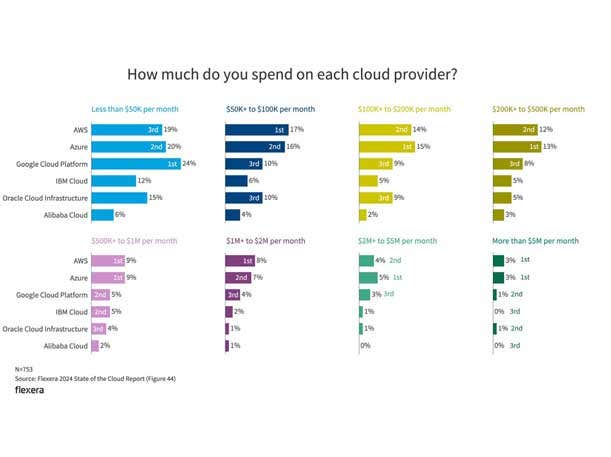
How much do you spend on each cloud provider?
One of the key results from Flexera’s survey shows just how much companies are spending on their cloud providers each month, with most companies spending between $50,000 and $500,000 per month.
AWS Spending: Approximately 19 percent of AWS customers report spending less than $50,000 per month; 17 percent spend between $50,000 and $100,000 each month; 14 percent spend between $100,000 to $200,000 per month; and 12 percent spend between $200,000 and $500,000 each month.
On the high end, approximately 9 percent of AWS customers spend $500,000 and $1 million each month; 8 percent spend between $1 million and $2 million per month; 4 percent spend $2 million and $5 million each month; and 3 percent spend over $5 million per month.
Azure Spending: Approximately 20 percent of Microsoft Azure customers report spending less than $50,000 per month; 16 percent spend between $50,000 and $100,000 each month; 15 percent spend between $100,000 and $200,000 per month; and 13 percent spend between $200,000 and $500,000 each month.
On the high end, approximately 9 percent of Azure customers spend $500,000 to $1 million each month; 7 percent spend between $1 million and $2 million per month; 5 percent spend $2 million and $5 million each month; and 3 percent spend over $5 million per month.
Google Cloud Platform Spending: Approximately 24 percent of Google Cloud customers report spending less than $50,000 per month; 10 percent spend between $50,000 and $100,000 each month; 9 percent spend between $100,000 and $200,000 per month; and 8 percent spend between $200,000 and $500,000 each month.
On the high end, approximately 5 percent of GCP customers spend $500,000 and $1 million each month; 4 percent spend between $1 million and $2 million per month; 3 percent spend $2 million and $5 million each month; and 1 percent spend over $5 million per month.
The Takeaway: Nearly 25 percent of AWS and Azure customers are spending between $500,000 and over $5 million per month on the two cloud leader’s platform. It’s key to note that customers monthly spending on AWS and Azure is nearly identical, with each spending category within 1-percenage point of each other.
Additionally, although Google Cloud adoption remains well behind that of AWS and Azure, it leads with those spending less than $50,000 per month. This aligns with respondents experimenting more with GCP compared to AWS and Azure.
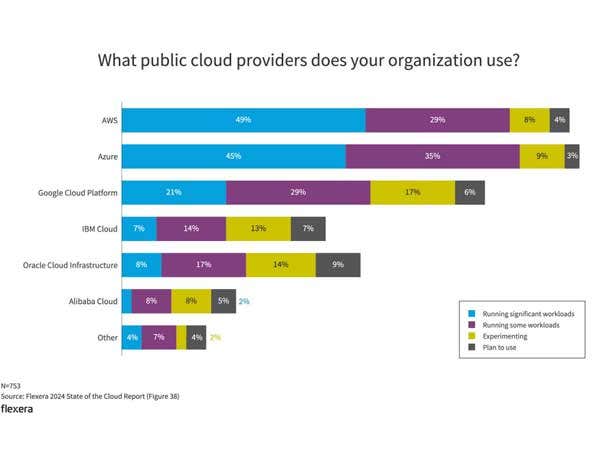
What public cloud providers does your organization use?
AWS was the leader in terms of the most chosen public cloud provider for running significant workloads on with 49 percent, followed closely by Microsoft Azure at 45 percent of respondents, then Google Cloud at 21 percent.
In terms of where customers are running some workloads, 35 percent use Azure, 29 percent leverage AWS, and 29 percent use GCP.
Looking at experimentation, 17 percent of respondents are experimenting with Google Cloud Platform, 9 percent experimenting on Azure, and 8 percent on AWS.
Other than the big three, 8 percent of respondents are running significant workloads on the IBM Cloud, 7 percent on Oracle Cloud Infrastructure, and 2 percent on Alibaba Cloud.
Approximately 17 percent of respondents are running some workloads on Oracle Cloud Infrastructure, followed by 14 percent on IBM Cloud, then 8 percent on Alibaba Cloud.
The Takeaway: AWS and Microsoft Azure continue to be the most widely used cloud platforms in 2024, while many are experimenting with GCP. In contrast, usage of Oracle, IBM and Alibaba Cloud remained relatively unchanged compared to the previous year.
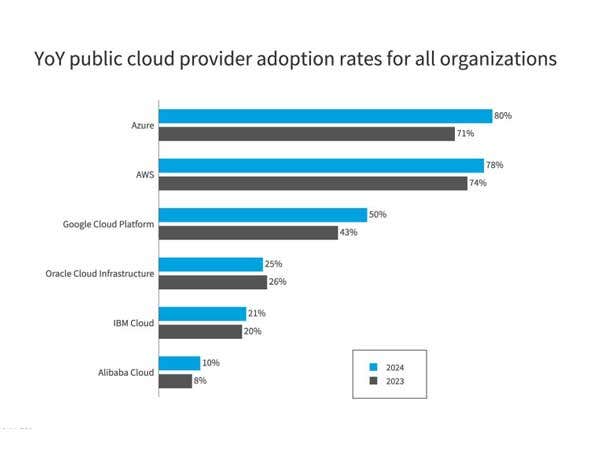
2024 Vs 2023 Public Cloud Provider Adoption Rates
Looking at adoption rates from 2023 compared to 2024, Flexera’s data shows Azure witnessed an 80 percent adoption rate, which was slightly higher than AWS at 78 percent. The Google Cloud Platform year over year cloud adoption rate was 50 percent.
Each of the top three cloud providers AWS, Azure and GCP gained adoption this year compared to 2023.
Interestingly, for the first time ever in Flexera’s State of the Cloud Report, a single cloud provider—Azure—reached the 80 percent threshold.
Looking at Oracle Cloud Infrastructure, IBM Cloud and Alibaba Cloud; each company’s 2024 adoption rates were nearly identical to 2023. Oracle had a year over year adoption rate of 25 percent, IBM’s rate was 21 percent and Alibaba adoption rate was 10 percent.
The Takeaway: Looking at 2023, AWS was in the lead with a 74 percent adoption rate versus 71 percent for Azure. However, Azure’s adoption rate climbed much higher compared to AWS over the past 12 months.
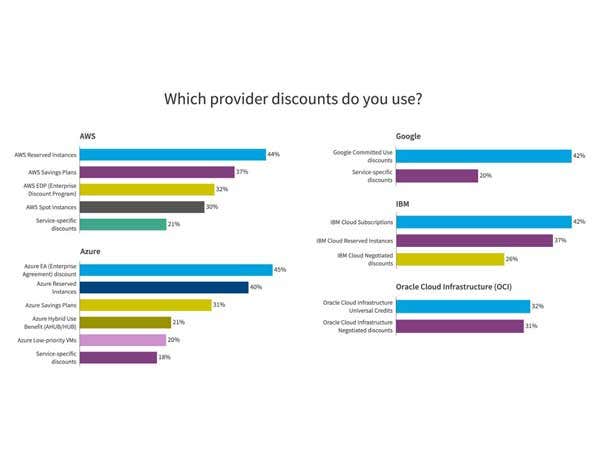
Which cloud provider discounts do you use?
Cloud provider pricing structures are complex and difficult to understand, but provider discounts offer major opportunities to reduce costs.
AWS: AWS’ most popular discount is its AWS Reserved Instances with 44 percent of respondents leveraging the discount.
Approximately 37 percent are using AWS Savings Plans discount, followed by AWS EDP (Enterprise Discount Program) at 32 percent, AWS Spot Instances at 30 percent, the Service-specific discounts at 21 percent.
Azure: Microsoft Azure’s most popular discount is the Azure EA (Enterprise Agreement) with 45 percent of respondents leveraging the discount.
About 40 percent of respondents leverage Azure Reserved Instances discount, followed by Azure Savings Plans at 31 percent, Azure Hybrid Use Benefit at 21 percent, Azure Low-priority VMs at 20 percent, and service-specific discounts at 18 percent.
Google: Google’s most popular discount being leverages is the Google Committed Use Discount at 42 percent. Approximately 20 percent of respondents are also leveraging service-specific discounts from Google.
IBM: IBM’s most popular discount, at 42 percent, is IBM Cloud Subscriptions. About 37 percent are leveraging IBM Cloud Reserved Instances, while 26 percent are using IBM Cloud Negotiated discounts.
Oracle Cloud Infrastructure (OCI): Between 31 percent and 32 percent of respondents are leveraging OCI Universal Credits or OCI Negotiated discounts.
The Takeaway: The majority of respondents are using either the Azure EA discount at 45 percent, AWS Reserved Instances at 44 percent, or Google’s Committed Use discount at 42 percent.
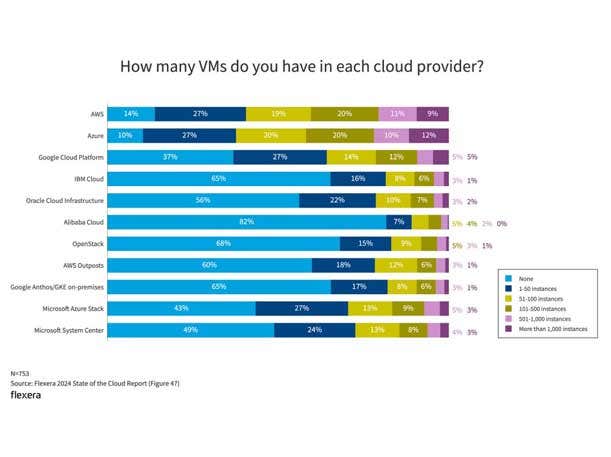
How many virtual machines (VMs) do you have in each cloud provider?
The number of virtual machines (VMs) or instances running in each cloud provides additional insight into the size of the organizational footprints within them.
For AWS, 66 percent of customers have between 1 to 500 instances on the AWS cloud, while 20 percent have 501 to over 1,000 instances running on AWS.
Looking at Microsoft, 67 of customers have between 1 to 500 instances on the Azure, while 22 percent have 501 to over 1,000 instances running on Azure.
Approximately 53 percent of customers on Google Cloud Platform have between 1 to 500 instances on GCP. About 10 percent of customers have 501 to over 1,000 instances running on GCP.
The majority of respondents did not have any instances running on IBM Cloud, Oracle Cloud Infrastructure or Alibaba Cloud. If they do have instances on those three platforms, the majority reported under 100 instances on average.
The Takeaway: AWS and Azure lead among the larger-footprint sizes of more than 500 instances, while GCP is solid for customers wanting 1 to 50 instances in the cloud.
In the private cloud/on-premises space, Microsoft offerings such as Microsoft Azure Stack and Microsoft System Center have more large-footprint deployments than either AWS Outposts or Google Anthos.