AWS Vs. Azure Vs. GCP: Flexera 2023 Customer Cloud Results
Flexera’s new 2023 State of the Cloud Report sheds light on hundreds of organizations’ cloud spending, adoption rates and more around AWS, Azure and GCP. Here are six interesting cloud results that you need to know.

Businesses of all shapes and sizes are spending millions of dollars each month on public cloud providers Amazon Web Services, Microsoft Azure and Google Cloud, as the three worldwide market share leaders battle for customer share in 2023.
The Flexera 2023 State of the Cloud Report released today sheds light on how 750 businesses are spending their public cloud dollars: including data on monthly spending, the number of viral machines (VMs) in public cloud, adoption rates and annual cloud spending—with nearly 25 percent of all respondents spending over $12 million per year in public cloud.
“This is a watershed year for cloud usage,” said Brian Adler, senior director of cloud market strategy at Flexera, in the report. “As economic uncertainties wane in the months or years to come, companies will continue to lean into the cloud to transform their businesses, with the goal of finding competitive advantages.”
[Related: Cloud Marketplace Guru On AWS, Microsoft, Google, ISV Trends]
Flexera 2023 State Of The Cloud
The new Flexera 2023 State of Cloud report surveyed 750 IT professionals and executive leaders worldwide representing a broad cross-section of industries and context areas.
The majority of respondents, around 67 percent, are from the United States, followed by 20 percent hailing from Europe, 6 percent from India, 5 percent from Australia and the remaining from Asia-Pacific. Flexera sources participants from an independent panel that is comprised of vetted respondents with detailed profiles.
Flexera’s survey this year leans toward larger enterprises, with 67 percent of all respondents in organizations with more than 2,000 employees. Additionally, 11 percent of businesses surveyed have more than 100,000 employees.
As of fourth quarter 2022, Amazon, via AWS, owns 33 percent share of the global cloud services market; followed by Microsoft, via Azure, at 23 percent share; then Google, via Google Cloud, at 11 percent market share, according to data from Synergy Research Group.
However, some of the survey results in Flexera’s new report sheds light on cloud adoption and spending trends in 2023 between the three cloud titans.
Here are some of the most interesting results from Flexera’s new cloud report comparing market leaders AWS, Azure and Google Cloud Platform (GCP).
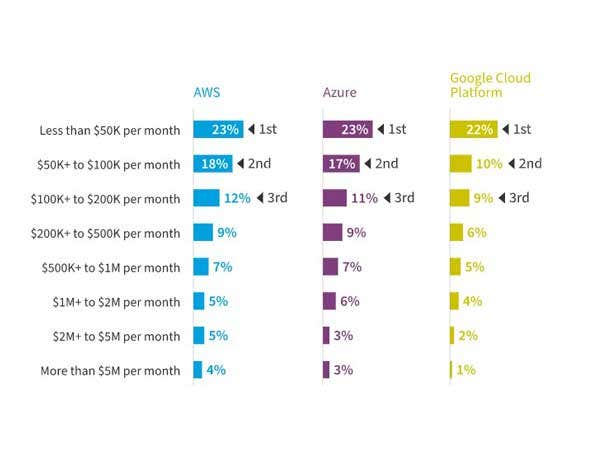
Monthly Spending On AWS Vs. Azure Vs. GCP
With all respondents, AWS leads or is tied in most spending tiers with the exception of those spending $1 million to $2 million per month, which is led by Azure.
Looking at AWS, around 39 percent of respondents spend between $50,000 to $500,000 per month, while 17 percent spend between $500,000 to $5 million. Approximately 23 percent of respondents, particularly SMBs, are spending less than $50,000 per month on AWS.
In terms of Azure, around 37 percent spend between $50,000 to $500,000 per month, while 16 percent spend between $500,000 to $5 million. Approximately 23 percent of respondents, particularly SMBs, are spending less than $50,000 per month on Azure.
Looking at Google Cloud Platform, around 25 percent spend between $50,000 to $500,000 per month, while 11 percent spend between $500,000 to $5 million. Approximately 22 percent of respondents, particularly SMBs, are spending less than $50,000 per month on Azure.
Overall, 14 percent of AWS users spend more than $12 million a year, compared to 12 percent for Azure and 7 percent for Google Cloud Platform.
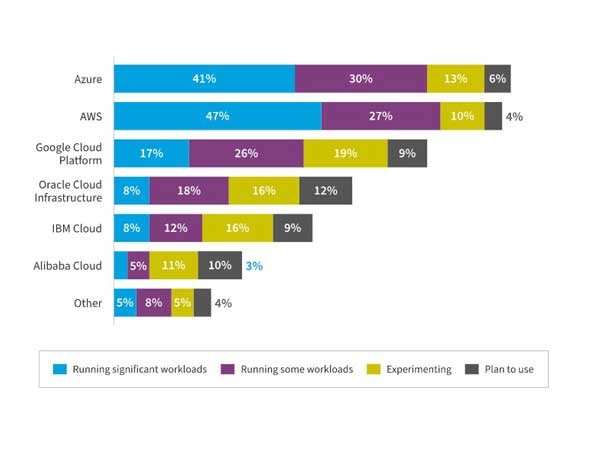
Cloud Providers Organizations Use...
For Running Significant Workloads:
AWS: 47 percent
Azure: 41 percent
GCP: 17 percent
For Running Some Workloads:
Azure: 30 percent
AWS: 27 percent
GCP: 26 percent
For Experimenting:
GCP: 19 percent
Azure: 13 percent
AWS: 10 percent
Last year was the first year Azure surpassed AWS in cloud adoption rates, according to data from Flexera. However, 2023 respondents indicated AWS is back on top with 47 percent using AWS in significant workloads versus Azure at 41 percent.
Approximately 30 percent of respondents are using Microsoft Azure for some workloads, followed by AWS at 27 percent, then Google Cloud Platform at 26 percent.
Respondents are experimenting most with Google Cloud Platform at 19 percent, followed by 13 percent experimenting with Azure, and 10 percent with AWS.
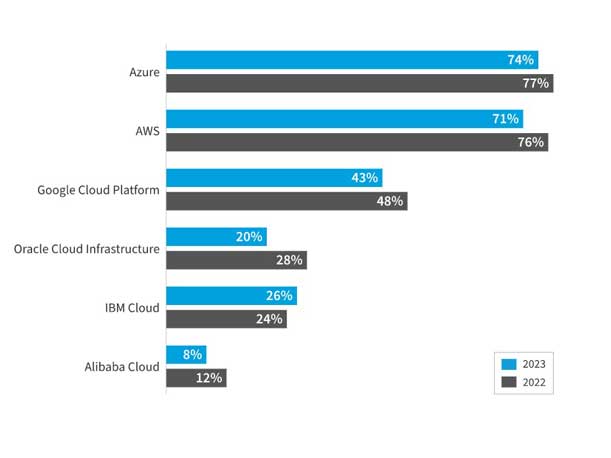
Year Over Year Public Cloud Provider Adoption Rates
Azure 2023: 74 percent
AWS 2023: 71 percent
GCP 2023: 43 percent
AWS and Azure remain the most widely adopted cloud providers, ahead of Google Cloud Platform as well as others such as Oracle Cloud Infrastructure, IBM Cloud and Alibaba Cloud. Azure leads in respondence adoption rates at 74 percent, followed by AWS at a71 percent, then GCP at 43 percent.
Azure 2022: 77 percent
AWS 2022: 76 percent
GCP 2022: 48 percent
Azure was slightly ahead of AWS in 2022 as well, with a 77 percent adoption rate, followed by AWS at 65 percent, then Google at 48 percent.
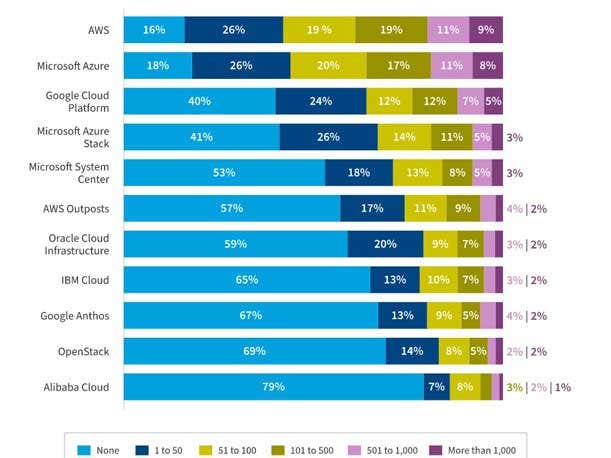
How Many VMs Do You Have In Each Cloud Provider?
The number of virtual machines (VMs) or instances running in each cloud, provides insight into the size of an organization’s footprint within them.
AWS and Microsoft Azure lead among the larger footprint sizes of more than 500 instances.
Interestingly, both the Microsoft Azure Stack and Microsoft System Center have more large footprint deployments than either AWS Outposts or Google Anthos.
Looking at Google, 24 percent of respondents have 51 to 500 VMs on GCP, and 12 percent with 501 to more than 1,000 VMs on Google.
Around 20 percent of AWS respondents have between 501 to over 1,000 VMs on AWS, while 38 percent have between 51 to 500 VMs on AWS.
Looking at Microsoft Azure, 19 percent of respondents have between 501 to over 1,000 VMs on Azure, while 37 percent have between 51 to 500 VMs on AWS.
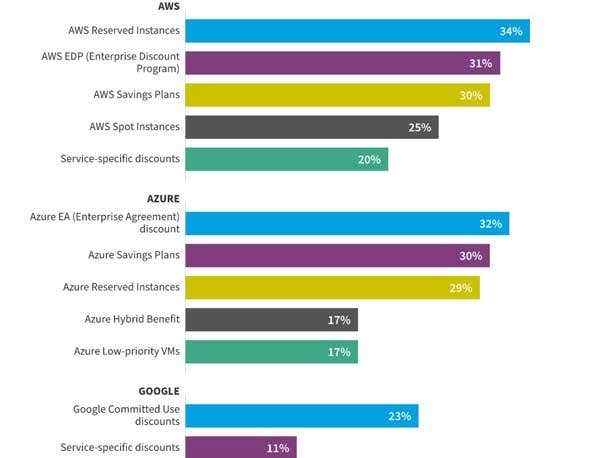
Provider Discounts Usage: AWS, Azure, Google
Cloud provider pricing structures are complex and difficult to decipher, but discounts are important to businesses as they create opportunities to reduce costs.
About 33 percent of all respondents are taking advantage of these savings opportunities. In many cases, Flexera said organizations can easily take better advantage of these discounts.
The most widely used cloud provider discount program is AWS’ Reserved Instances with 34 percent of respondents leveraging the discount, followed by Microsoft’s Azure Enterprise Agreement (EA) discount at 32 precent, then AWS Enterprise Discount Program (EDP) at 31 percent.
Other heavily-used cloud provider discounts include AWS Saving Plans and Azure Saving Plans at 30 percent, as well as Google Committed Use discounts at 23 percent.
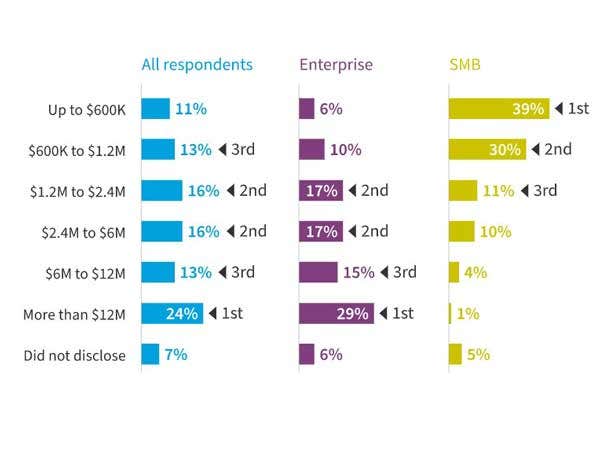
Annual Public Cloud Spend
Nearly a quarter of all 750 respondents are currently spending more than $12 million per year in the public cloud. Additionally, more than half of all respondents’ workloads and data are in public cloud today.
Approximately 24 percent of respondents are spending over $12 million annually in public cloud, while 13 percent are spending between $6 million to $12 million each year.
Around 32 percent are spending between $1.2 million to $6 million on public cloud, while 13 percent are spending in the range of $600,000 to $1.2 million. Only 11 percent of respondents, mostly SMBs, are spending less than $600,000.
Looking at enterprise respondents, approximately 50 percent are spending between $1.2 to $12 million annually on public cloud, while 29 percent are spending more than $12 million each year.