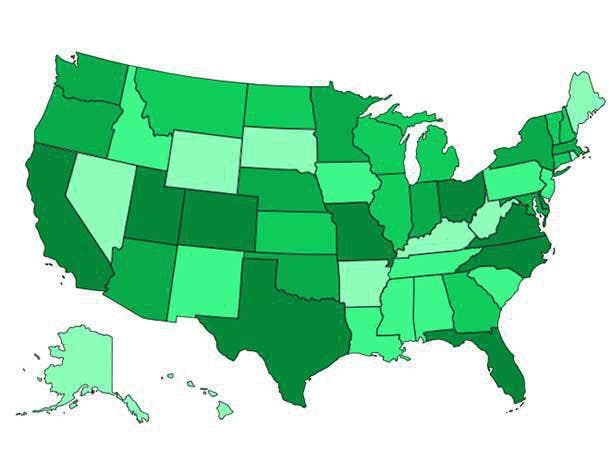
CRN 2019 Best States Methodology
Here we break down the data sources used in this year's analysis of the best states to start and grow a solution provider business.

The goal of CRN's annual Best States analysis is to provide readers with a comprehensive view of the economic, workforce and channel climate in each state. The conclusions can be used by entrepreneurs who are considering starting a solution provider business or by solution provider owners and executives who might be looking for expansion opportunities.
This year's Best States analysis incorporated many of the same criteria and data sources used in previous years – updated with the most recent data available. New criteria considered in this year's analysis included state GDP growth rates, fiscal stability and each state’s internet broadband coverage.
The criteria covered multiple broad categories including labor and operating costs, the education and experience level of a state's workforce, taxes and regulatory burden, state infrastructure, and personal cost of living/quality of life. Data was also analyzed to rank states for their levels of entrepreneurship and innovation, and business climate/competitive environment.
[RELATED: Top States For Business In 2019: Starting A Solution Provider Company]
A state's rise or fall in the Best State's rankings may be due to actual changes in a state's situation (a significant tax rate hike or cut, for example, or increased hiring in a state's tech sector). State rankings can also change with the inclusion of new data that can provide a clearer analytical picture of a state, with changes in the analytical weighting of the data, or any combination of those.
This year, for example, Washington moved up to No. 5 in the Best States rankings from No. 11 last year, thanks to significant gains in its rankings for business climate/competitive environment and in workforce education and experience. Arizona made it into the top 10 (at No. 9) this year because of significant gains in its scores for workforce education and for entrepreneurship/innovation. And Georgia moved up to No. 15 from No. 24 last year after improving its rankings in workforce education and in labor and operating costs.
Missouri, on the other hand, slipped in this year’s rankings to No. 8 from No. 3 last year. New and updated data resulted in the Show Me State dropping in its rankings in labor/operating costs and personal cost of living/quality of life.
Data used in the Best States analysis came from a wide range of sources. The annual CompTIA Cyberstates report was the data source for several criteria including tech industry employment and wages, the number of tech business establishments in each state, and the tech sector as a percentage of total gross state product.
Most of the state taxation data, including corporate, sales and personal income tax rates, came from The Tax Foundation's 2019 State Business Tax Climate Index and from the Small Business & Entrepreneurship Council report.
Government agencies are a critical Best States data source including the Bureau of Labor Statistics (unemployment rates and union affiliation), the Bureau of Economic Analysis (state GDP), the Small Business Administration (the number of small businesses in each state) the U.S. Census Bureau, the U.S. Federal Aviation Administration and the U.S. Department of Transportation.
Data from a wide range of educational and research institutions was used in the analysis, including the American Community Survey and the Economic Policy Institute. Data on entrepreneurship and startup growth rates came from the Kaufmann Foundation's Kauffman Index reports, as did data about household income.
The number of solution providers per state – and the solution provider competitive saturation rank – came from a database maintained by The Channel Company, the parent company of CRN. The ranking was calculated based on the number of businesses in each state per solution provider – an indication of the competition a solution provider would face in recruiting customers.
Data about home prices and rental costs came from Zillow while information about each state's public transportation systems came from the U.S. Department of Transportation’s 2019 Infrastructure Report Card and the Center for Neighborhood Technology 2019. Gas price data came from AAA. Data about the states most prone to natural disasters came from WorldAtlas.com while data about natural disaster preparedness came from the National Health Security Preparedness Index from the Robert Woods Johnson Foundation.
The Best States analysis also incorporated state rankings on a range of criteria developed by other business media including CNBC America's Top States for Business 2019, U.S. News and World Report's Best States rankings and FitSmallBusiness.com. The results of several WalletHub state rankings were incorporated into the Best States research including WalletHub 2019 Best and Worst State Economies, WalletHub 2019 Best and Worst States to Start a Business and WalletHub 2019 Most and Least Educated States in America.