Here's Who Made Gartner's 2018 Magic Quadrant For Business Intelligence And Analytics Platforms

A New Business Analytics Wave On The Horizon
The analytics and business intelligence software industry has completed its transition from the IT-centric reporting products that dominated the 1990s and early 2000s to today's more business-centric analytics software that emphasizes self-service usage by business users and everyday knowledge workers. The shift has spawned a new generation of business analytics platforms from startups that compete with new products from long-established players.
But market researcher Gartner notes that even as this transition ends, a new "wave of disruption" has begun in the business analytics arena with new and established vendors developing "augmented analytics" products that use machine learning and artificial intelligence capabilities to mine new insight from voluminous – and sometimes fast-moving – data.
Which business intelligence and analytics software vendors are leading the way with these transitions? And who are the followers? Gartner's 2018 Magic Quadrant for Analytics and Business Intelligence Platforms gives us some clues.

The Future Of Business Analytics
The Gartner report includes a number of planning assumptions that by 2020:
- Augmented analytics, which includes natural language query and narration, augmented data preparation, automated advanced analytics and visual-based data discovery capabilities, will be a dominant sales driver for business intelligence, analytics, and data science and machine-learning platforms and of embedded analytics.
- The number of users of modern business intelligence and analytics platforms that are differentiated by augmented data discovery capabilities will grow at twice the rate — and deliver twice the business value — of those that are not.
- Natural-language generation and artificial intelligence will be standard features of 90 percent of modern business intelligence platforms.
- Fifty percent of analytical queries will be generated via search, natural-language processing or voice, or will be automatically generated.
- Organizations that provide users with access to a curated catalog of internal and external data will derive twice as much business value from analytics investments as those that do not.

Analytics And BI Platform Magic Quadrant Methodology
Vendors were defined and assessed according to product capabilities across five use cases: agile centralized BI provisioning, decentralized analytics, governed data discovery, OEM or embedded BI, and extranet deployment.
The 15 critical product capabilities were in five areas: infrastructure (BI platform administration, cloud BI and data source connectivity and ingestion); data management (metadata management, self-contained ETL and data storage, self-service data preparation, and scalability and data model complexity); analysis and content creation (advanced analytics for citizen data scientists, analytic dashboards, interactive visual exploration, augmented data discovery, and mobile exploration and authoring); sharing of findings: (embedding analytisc content, publish/share/collaborate on analytics content); and overall platform capabilities (ease of use, visual appeal and workflow integration).
Vendor positioning in the Magic Quadrant is determined by their ability to execute and completeness of vision.
Ability to execute is based on how a vendor's product or service stacks up against the 15 critical capabilities, as well as their sales execution, market responsiveness and track record, operations and overall viability.
Completeness of vision is judged on their understanding of how market forces can be exploited to create value for customers and opportunity for themselves and their ability to support the key trends that will drive business value in 2018 and beyond. Specific criteria include vendors' ability to innovate and their product, sales, marketing and vertical industry strategies.

Leader: Microsoft
Microsoft is one of three vendors in the Leader quadrant and, as it has been for several years, is the furthest of any company along the "Completeness of Vision" axis. Microsoft Power BI offers data preparation, data discovery, interactive dashboards and augmented analytics via a single product. It is available as a SaaS option running in the Azure cloud and, new in 2017, as an on-premises Power BI Report Server.
Strengths: Microsoft is the low-priced incumbent, according to Gartner, and the vendor has put downward price pressure on the BI/analytics market. The company significantly grew its subscriber base in 2017: Some customers cite the software's ease of use and visual appeal as the main buying criterion. The company continues to execute on its product road map, adding the Quick Insights augmented data discovery feature in 2017. Microsoft and Sisense had the highest customer reference scores.
Cautions: The majority of Microsoft's customers use Power BI for parameterized reports and dashboards, rather than for more complex analytical tasks, putting it in the bottom quartile for breadth of use. While the core of Power BI is a self-contained product, some functionality requires integration with other Microsoft products. Some customers were frustrated with changes in pricing and packaging, according to Gartner.

Leader: Tableau
Tableau joins Microsoft and Qlik in the Leader quadrant, scoring highest (slightly above Microsoft) on the "Ability to Execute" axis, but behind Qlik and several other vendors on the "Completeness of Vision" axis. Tableau's interactive visual-based software is popular and the company added a number of enterprise features, including collaboration and enhanced software developer tools, as it targets large enterprise sales and deployments.
Strengths: Gartner calls Tableau the "gold standard" for interactive visual exploration and analytics dashboarding. The company and its products score in the highest quartile for customer experience, business benefits and user enablement. Average deployment sizes continue to grow and customers have flexible options of deploying Tableau on-premises or in the cloud.
Cautions: More BI/analytics software vendors are offering visual data exploration capabilities, making for a more competitive market. Some customers cite high license costs as a limitation to broader deployment. Lack of complex data modeling support is a product limitation, according to Gartner, and the vendor's product development efforts have focused on enhancing the product – especially in enterprise features and extensibility – rather than investing in next-generation capabilities.

Leader: Qlik
Qlik, the third company in the Leader quadrant, competes in the market for visual data discovery and analytics with its Qlik Sense (50 percent of license revenue), QlikView and Qlik Analytics Platform products. In 2017 Qlik acquired Idevio to bring geoanalytics capabilities to its product set.
Strengths: Qlik's software incorporates the Qlik Associative Engine, a product differentiator that supports multiple data sources, complex data models and complex calculations. Gartner also cites Qlik's network of more than 500 systems integrators and 1,700 partners as a key strength – an estimated 70 percent of Qlik implementations are partner-led.
Cautions: Gartner cited the cost and complexities of migrating from QlikView to Qlik Sense as a challenge and said the company has experienced slowed market momentum – possibly the result of recent sales force reductions and changes in the company's top leadership, including CEO and CTO.

Challenger: MicroStrategy
MicroStrategy, which was in the Visionary quadrant last year, moved into the Challenger's quadrant in this year's Magic Quadrant because of an improved ability to execute – the result of what Gartner describes as its "leading product capabilties." MicroStrategy Version 10 combines self-service data preparation, visual-based data discovery and exploration, native big data connectivity and enterprise analytics.
Strengths: MicroStrategy's product scores were among the highest of all vendors in the Magic Quadrant with its long list of capabilities packaged in an integrated product for all use cases. Many MicroStrategy installations are large-scale, enterprisewide deployments. The company also scores well for its customer-focused initiatives.
Cautions: MicroStrategy's system is generally seen as requiring more IT involvement for implementation, administration and content development. While the company is strong among its installed base, it has had limited success in attracting new customers. And while MicroStrategy is focused on expanding enterprise functionality, Gartner warns it may not be doing enough in the areas of "disruptive innovation and AI-driven user experiences."

Visionary: Sisense
Sisense scores the highest on "ability to execute" among all seven vendors in the Visionary quadrant. The company markets an integrated analytics and BI platform, including visual data exploration and advanced analytics, with built-in workflows from data collection to storage using an in-memory columnar database.
Strengths: Sisense 7 was released in October 2017 with improved self-service data preparation and better cloud and mobile support. Customers place Sisense in the top quartile for ease of content development and visual appeal. The company has strong market momentum with 70 percent revenue growth in 2017, with OEM and embedded applications accounting for more than half of the company's sales.
Cautions: Most Sisense deployments are among SMB customers with the average size only around 300 users, placing it in the bottom quartile of Magic Quadrant vendors. Most are also using the software to analyze relatively small data volumes. Gartner said product limitations in interactive visualization and augmented data discovery remain.

Visionary: Salesforce
Salesforce, the fast-growing developer of CRM and other cloud applications, has the highest "completeness of vision" positioning among all the vendors in the Visionary quadrant and higher in "ability to execute" than any other visionary except for Sisense. The company develops multiple analytical products including the Einstein Analytics Platform, Einstein Discovery and Einstein Analytics-based packaged applications.
Strengths: Salesforce is a leader in augmented analytics with its Einstein Discovery, according to Gartner, and the company has the potential to bring prescriptive, AI and machine-learning-driven insight to basic Salesforce reports and dashboards. Einstein Data Insights, a product now in pilot trials, represents a "compelling vision," according to the Gartner report. The vendor's robust partner ecosystem, including systems integrators and ISVs, and marketplace are competitive advantages.
Cautions: Salesforce has acquired a dozen AI-centric companies in the past four years and the vendor's penchant to brand all AI services and applications as "Einstein" is "confusing and potentially costly for buyers," according to Gartner. Customers also say the high cost of Salesforce software is a barrier to broader deployment.
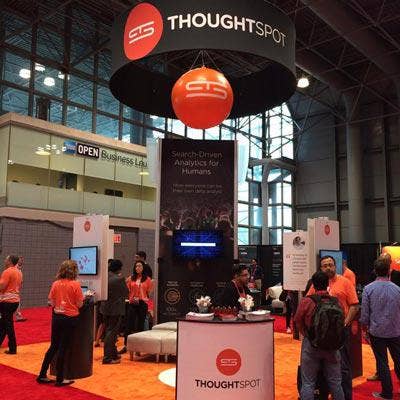
Visionary: ThoughtSpot
ThoughtSpot provides visual data exploration software with a search-based interface. Added to the Magic Quadrant last year as a niche player, the company moved to the Visionary quadrant because of its expanded road map and differentiated marketing. The vendor's new SpotIQ added augmented analytics to its product portfolio.
Strengths: Customers describe ThoughtSpot's search interface as an innovative way to bring analytics to new users and use cases. The vendor's software supports complex search and performance at scale, working with terabytes of data, and the company's technology with augmented analytics is "innovative." The company has market momentum, having tripled the size of its customer base in the past year.
Cautions: ThoughtSpot requires all data be loaded into its in-memory engine, a problem for users with slow and disparate data sources, according to Gartner, and the vendor's product lags in interactive visual exploration with data manipulation capabilities. ThoughtSpot lacks the global geographic presence of some of its competitors and skilled resources for ThoughtSpot's technology are in short supply.

Visionary: SAS
SAS retains its position in the Visionary quadrant with its SAS Visual Analytics software for reporting, interactive discovery and dashboards for mainstream business users and more advanced analytics capabilities for "citizen data scientists." In March 2017 SAS debuted a major new release of the software running on the SAS Viya in-memory microservices architecture.
Strengths: Visual Analytics is a comprehensive product for multiple use cases and appeals to a wide range of business users. The company also offers a number of pre-built industry and horizontal solutions, particularly in fraud and risk management, Internet of Things and customer intelligence. Gartner also gives SAS high marks for its product road map.
Cautions: SAS placed in the bottom quartile for ease of use, although the new release of SAS Visual Analytics improved the product's usability and visual appeal. Migrating to new versions of SAS software is a challenge for some customers, according to Gartner, while the cost of SAS products is "a perennial limitation to wider deployment" for the vendor's products.

Visionary: SAP
Software giant SAP markets a number of business intelligence and analytics products including SAP Lumira and SAP Analytics Cloud. The vast majority of companies that use SAP analytics and BI products do so because they have standardized on the vendor's enterprise applications.
Strengths: SAP Analytics Cloud integrates analytical, planning and predictive capabilities in a single platform, while the Lumira discovery tool wins customer praise for its data access capabilities and integration with enterprise applications. The vendor's Analytics Hub is illustrative of the company's cloud-centric, hybrid computing vision and product road map.
Cautions: SAP's business analytics products have functional limitations, including in advanced analytics and metadata management for Lumira and in scalability and complexity, data source connectivity and ingestion, and augmented data discovery for SAP Analytics Cloud. Some customers also gave the products low scores for product quality and performance.

Visionary: Tibco Software
Tibco's Spotfire data discovery tool, with its interactive visualization capabilities and data preparation tools in a single package, was an early disrupter that helped transform the market from traditional reporting to modern analytics and BI, according to the Gartner report. Tibco recently acquired Alpine Data Labs and its cloud-based data science and social collaboration platform.
Strengths: Customers give Tibco Spotfire high marks for its advanced data exploration and ability to perform complex analysis tasks, as well as its integrated data science and machine-learning technology. The vendor also wins points for its global customer base of advanced users, its investments in augmented data preparation and discovery, and its "forward-looking" road map for Spotfire.
Cautions: Reference customers placed Tibco in the bottom quartile for their experience working with Tibco sales and they cite the vendor's high licensing costs as a hindrance to broader deployment of Spotfire. The product also provides less intuitive content authoring for casual business users.
Visionary: IBM
IBM competes in this market with its IBM Cognos Analytics, which was recently redesigned, and the newer IBM Watson Analytics. IBM was the lowest-ranked vendor in the Visionary quadrant in both completeness of vision and ability to execute. IBM "has lost some traction relative to other vendors in the market," according to Gartner.
Strengths: IBM is a leader in adding augmented analytics or "smart" capabilities to its products and Cognos Analytics functions in both standard reporting and visual/exploratory analysis modes. IBM has a strong base of traditional BI technology users.
Cautions: The revamped Cognos Analytics has been slow to gain traction among new customers and upgrades from existing users. Some cite the software's limited ability to perform complex analytics. Watson Analytics, meanwhile, is a less mature product with some functionality gaps in administration and functionality.
Niche Player: Birst
Birst markets an end-to-end cloud platform for business intelligence, data analytics and data management. Its software is centered on the idea of "networked analytics," the ability to connect both centralized and de-centralized users that share common business analysis rules and definitions. Birst was acquired by application company Infor in 2017 and operates as an independent business unit.
Strengths: Birst is often the standard business analytics system in organizations where it is deployed. Customers cite its cloud deployment model as an attractive feature, as well as its support for a wide range of data sources, according to Gartner. Another selling point is its low total cost of ownership.
Cautions: Many customers use Birst's software for limited reporting and dashboard tasks rather than more sophisticated analysis, possibly due to below-average scores for ease of use. Customer support scores were in the bottom quartile and some cited the limited availability of skilled resources from the vendor.

Niche Player: Domo
Startup Domo develops a cloud-based analytics and BI platform targeted at senior executives and line-of-business users. The software is often deployed with little or no support from central IT. The company has gained a lot of attention because of the huge amount of venture funding ($690 million) it has received.
Strengths: Domo scores in the top quartile for its ease-of-use capabilities, for the ability to rapidly deploy management-style dashboards, and for the business benefits it provides. The vendor scored higher than any vendor in the Magic Quadrant for customers' sales experience, according to Gartner, and gets high marks for training, documentation and tutorials.
Cautions: While Domo's software provides interactive data discovery and visualization capabilities, most customers use the product for dashboards with few using it for more complex interactive visualization. Most customers don't use Domo as their enterprise BI system – it's mostly deployed on a line-of-business basis. And some customers say Domo's support needs improvement.

Niche Player: Looker
Looker, which markets a modern analytics and business intelligence platform, is appearing for the first time in the Gartner Magic Quadrant. The company positions itself as a data platform that works in conjunction with other BI, marketing analytics, sales analytics and data visualization tools. Key elements of its product portfolio are its Viz Blocks pre-defined visualizations, and Data Blocks data sources combined with data models.
Strengths: Gartner says the Looker product is agile and supports a wide range of use cases including decentralized analytics, centralized BI and governed data discovery. Looker wins top customer scores for support, product quality and migration experience and the company has invested in user enablement programs. It has market momentum in customer growth, up 56 percent in 2017 to 1,200 customers.
Cautions: Looker's product road map remains relatively narrow, according to Gartner, and its products lack some advanced features including advanced algorithms and natural language integration. Gartner also reported that customers believe the product could improve its ease of use. The vendor remains largely focused on the North American market.
Niche Player: Information Builders
Information Builders' WebFocus is the vendor's flagship analytics and business intelligence platform. Gartner evaluated its InfoAssist+ software that includes components from the WebFocus stack and is designed to meet self-service analytics and BI needs, according to Gartner.
Strengths: InfoAssist+ can be deployed for a wide range of use cases, including decentralized analytics and traditional IT-centric reporting, according to Gartner. The product has strong core functionality in platform administration, security and architecture, mobile exploration, embedded analytics content, data source connectivity, and self-contained ETL and data storage. Information Builders' high level of customer support and its portfolio of pre-packaged analytical applications score points for the company.
Cautions: InfoAssist+ doesn't have a lot of market momentum and its ease-of-use capabilities are viewed as below average, according to Gartner. The product also has areas of limited functionality including self-service data preparation and augmented analytics.

Niche Player: Oracle
Oracle markets a broad range of BI and analytics products, both for on-premises and in the cloud. Gartner focused on the Oracle Data Visualization product, which provides integrated data preparation, data discovery and advanced exploration, and interactive dashboards. Gartner said Oracle has closed many basic feature gaps in ODV's data preparation, interactive visualization and dashboarding capabilities in the past year.
Strengths: Oracle Data Visualization supports a broad range of analytical use cases and the product offers flexible deployment options in on-premises or in Oracle's global cloud system. Gartner gives Oracle points for its product vision, including making "significant investments" in augmented analytics and virtual reality.
Cautions: Customer scores place Oracle in the bottom quartile for the experience of working with the company's sales operations, as well as giving the vendor low scores for customer experience and operations. ODV is also seen as being very Oracle-centric, primarily deployed in organizations that use other Oracle enterprise applications and data management products, and is "largely unproven" outside Oracle's customer base, according to Gartner.

Niche Player: Board International
Board International develops a system that integrates business intelligence, analytics and financial planning and analysis in an integrated, self-contained platform. The company has focused on large enterprise customers, particularly in the U.S. where Gartner said it has seen significant growth in its customer base and 45 percent revenue growth in the past year.
Strengths: Board's unified BI, analytics and corporate performance management system is highly differentiated in the market. The product can be used in centralized and de-centralized use cases, and received high customer scores for the broad range of applications for which it can be used. Gartner said the company has a loyal customer base.
Cautions: Board's software is used on the smallest data sets among all the vendor's in the Magic Quadrant, according to Gartner, with data coming from traditional relational sources, with no Hadoop or NoSQL data sources. The market researcher also concludes that Board "lacks a compelling vision for the future of its platform" and the vendor needs to step up its efforts to generate market awareness of its product.

Niche Player: Yellowfin
Australia-based Yellowfin develops a web-based BI and analytics platform. The channel accounts for about 30 percent of the company's revenue with OEMs a key route to market. The company released Yellowfin 7.4 in October with machine-learning capabilities and a new lightweight data preparation toolset.
Strengths: Yellowfin's web-based software offers reporting, interactive visualization, dashboards, threaded discussion scheduling and alerts in a single package. Reference customers cite the software's low licensing costs as a major advantage. Starting last year Yellowfin's software is available in the cloud running on AWS and NTT Communications.
Cautions: Scalability is a concern with Yellowfin deployments in the smaller ranges, according to the Gartner report, and some customers say they have had difficulty handling higher data volumes with the product. The company is also hindered by low market awareness and momentum and ranks low in its understanding of the market due to the product's relatively limited breadth of use by reference customers.

Niche Player: Pyramid Analytics
Pyramid Analytics provides an integrated suite of products for BI and analytics, including a range of analytics capabilities spanning ad hoc analysis, interactive visualization, dashboards, mobile, collaboration and alerts. The company, which launched Pyramid 2018 last year, was the lowest positioned of all companies on the "completeness of vision" axis of the 2018 Magic Quadrant among all vendors.
Strengths: Because of its broad capabilities, the Pyramid platform is deployed for a wide range of use cases. Reference customers say the system is easy to implement, administer, support and migrate. And the product is integrated with Microsoft's environment with 70 percent of implementations tapping into Microsoft-based enterprise data warehouses.
Cautions: Pyramid scores low on innovation and product vision road map, according to Gartner. The company lacks differentiation in a crowded market and there is a shortage of resources skilled in working with the product. Growing competition from Microsoft's business intelligence products are seen as a potential threat to the company's viability.
Niche Player: Logi Analytics
In 2017 Logi Analytics' underwent some significant changes, undertaking a major overhaul in product positioning and packaging to focus on providing BI and analytics technology for embedding in websites and applications. And a global private equity firm that specializes in growing software companies acquired Logi Analytics. The vendor was the lowest-positioned company on the Magic Quadrant on the "ability to execute" axis.
Strengths: Logi Analytics appears to be reaping some success from its focus on OEM and embedded analytics. Customer references give top scores to the functionality of the company's products in BI platform administration, security and architecture, data source connectivity and ingestion, interactive visual exploration and analytical dashboards. Low licensing costs and ease of use for content developers are also strengths.
Cautions: Logi Analytics is in the bottom quartile for its use for complex analytical tasks with most customers using it for consuming parameterized reports and dashboards. While the Logi software can run on AWS and Microsoft Azure, the company offers no direct cloud service and does not host or manage customer data. Gartner also cited concerns over the vendor's market relevance and customer retention.

Who's In And Who's Out In This Year's BI/Analytics Magic Quadrant
Gartner always adds and drops vendors from each year's Magic Quadrants as markets change and Gartner adjusts its inclusion criteria. The inclusion of a company on a Magic Quadrant one year and not the next doesn't necessarily signal a change in Gartner's opinion of the company, according to the market research firm. Some may be added to other Magic Quadrants with different inclusion criteria.
Added: Looker
Dropped: Alteryx is now in the Magic Quadrant for Data Science and Machine Learning. ClearStory Data and Zoomdata did not meet the inclusion data for this year's BI/Analytics Platform Magic Quadrant. And Datameer and Pentaho were excluded because they shifted their market emphasis, Gartner said.