CA To Release A Business Intelligence Solution For ARCserve and XOsoft
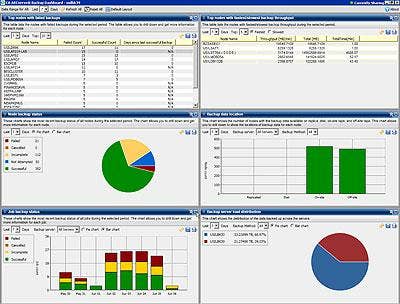
Overview Of ARCserve Backup Dashboard
Known for its best of breed backup, disaster recovery and high availability replication solution, CA is about to bump up the stakes when it releases a new business intelligence Web-based tool for ARCserve and XOsoft that takes advantage of their integration. The Web-based BI application is scheduled for release in July and it is going to change the way storage/network administrators and VARs manage storage.
No more guessing and tracing failed jobs. Corporate wide backup deployments are now at the tip of one's fingers.
On the upper left side, storage/network administrators will be able to track production servers or nodes that they want to see. The list is indexed and can be sorted. All of the panes are configurable.
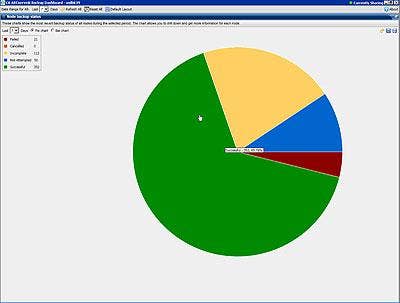
Pie Chart Of Node Backup Status
By sliding the mouse over the pies, administrators can get a quick glimpse at the state of all of the devices in real time. Clicking on the pie opens up all of the nodes that have failed.
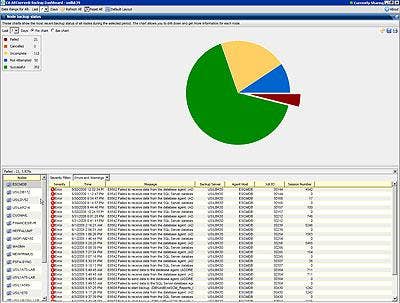
Listing Of Errors For Backup Servers
From the first item on the starting workspace, administrators will be able to see the number of failures of each device. Following the column with "Days since the last successful backup," administrators will be able to identify problems that occur but were not identified for whatever reason.
This pane shows the details of each error. Honing on the devices that are failing is really easy. The device list and names are grouped in this chart. By selecting a node, administrators can drill down quickly on specific errors that occurred on that node.
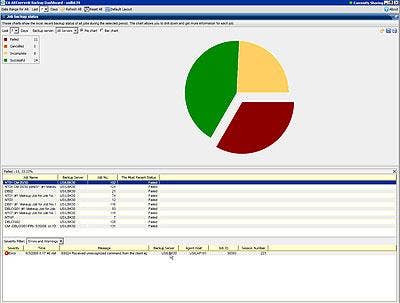
Listing of Backup Jobs For Backup Servers
Some administrators like the node-centric view while others like the job centric view. In this pane, administrators can track failures based on jobs that are running. Based on the volume of jobs running, administrators can pick and choose views. It's a matter of preferences based on the workload as well.
The pane makes is easy to identify errors in each backup job.
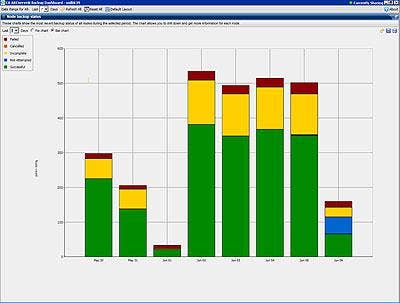
Bar Chart Showing Performance of Backup Devices Over Time
The bar chart is critical for identifying trends. Administrators can track the history of devices and jobs graphically.
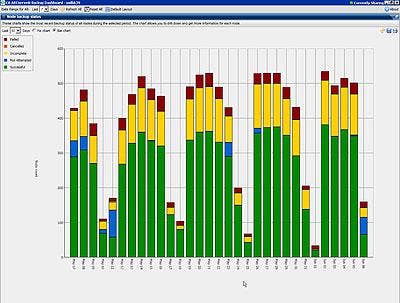
More Details of Bar Chart Showing Performance Of Backup Devices
The bar chart history is quite flexible. Administrators can expand the number of days that they like to view. At this point, administrators will not be able to select the history of individual nodes. CA is working on that feature for the next release. Administrators will be able to track groups of nodes only.
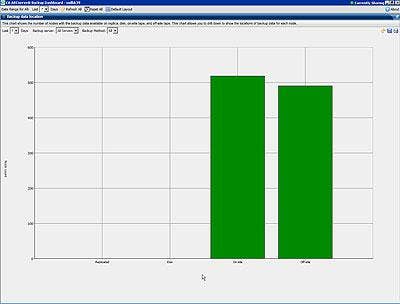
Location of Backup Data
This bar graph shows the number of nodes whose backup data is available on XOsoft replicas, disk, on-site tape and off-site tape. This chart allows you to drill-down to show the location of backup data for each node.